Epistemic Challenges for Subsurface Engineering, Part II: Creating Value with a Hypothesis-Driven Workflow
How can we reconsider our approach to subsurface engineering in order to evaluate claims of truth and drive long-term value? I propose a hypothesis-driven approach, in which field testing is placed at the center of our efforts to assess the truth and improve over time. Physics-based and data-driven approaches are used as hypothesis-generating activities that motivate and prioritize hypothesis testing through field operations. Effective field testing requires the coordination of operations to enable clean well-to-well production comparisons and the design of data collection to enable strongly supported conclusions. Field testing need not increase the cost of field operations if it is done through intentional and thoughtful planning.
Epistemic Challenges for Subsurface Engineering, Part I: The Persistence of False Beliefs
In a recent blog post, I outlined how companies use field tests, modeling, statistical analysis, and laboratory studies to improve over time. Information is synthesized as part of an iterative process of continuous improvement. In this post, I discuss what happens when the process of continuous improvement runs into trouble. In uncertain environments (like subsurface shale), there is a tendency toward overconfidence. We need to act, and in doing so convince ourselves that we are making the right decision. Sometimes we hire experts who ‘confidently confirm’ our beliefs. This is symptomatic of a phenomenon called confirmation bias, where we tend to ignore new data and outcomes that contradict our initial beliefs. After committing to strong claims, we may have difficulty changing course when it becomes apparent that they are not consistent with observations. This can cause false beliefs to persist for years, long after they have been falsified by field data.
Geologists Recommend Eating At Least One Small Rock Per Day

Professor Zoback in The Onion
Why Multistage Stimulation is the Most Exciting Idea in Geothermal

This blog post reviews technical opportunities and challenges for next-generation geothermal systems. Multistage hydraulic stimulation, which has been transformative in the oil and gas space, has the potential to create a breakthrough for geothermal energy.
Notable Papers from HFTC 2021

Highlights from the 2021 SPE Hydraulic Fracturing Technology Conference
Recorded ARMA HFC ‘Warm-Up’ series webinar – A Continuous Fracture Front Tracking Algorithm with Multi-Layer Tip Elements (MuLTipEl)

In this talk delivered for ARMA HFC ‘Warm-Up’ webinar Series, Egor Dontsov outlines his latest work at ResFrac, which raises the bar in hydraulic fracture modeling by creating a continuous fracture front tracking algorithm with multi-layer tip elements (MuLTipEl).
What’s New: HFTC, the Parent/Child Industry Study, HFTS2, Supercritical Geothermal, DFIT, and Automated History Matching

This post reviews some of the more interesting things happening at ResFrac right now: HFTC paper with Apache on Calibrating models with offset fiber, parent/child well industry study, HFTS2 project, engineering geothermal systems, DFIT’s and automated history matching.
Introducing ResFrac’s Sensitivity Analysis Tools

ResFrac’s sensitivity analysis tools help operators to create, run and interpret batches of simulations that vary systematically, enabling convenient and reliable work flows to test ideas and optimize economic performance.
The ResFrac Parent/Child Industry Study has Kicked Off!

ResFrac’s Industry Study will be studying the interactions between parent wells and child wells (infill wells) to identify optimizations that improve economic performance.
Why Deep Closed-Loop Geothermal Is Guaranteed To Fail

Deep closed-loop geothermal relies on heat conduction to bring energy to the wellbore. Conduction through rock is slow: a fundamental problem that will prevent the concept from ever being economically viable.
Integrated Reservoir Modeling Supports a Culture of Continuous Improvement

The ResFrac mission is to accelerate the process of continuous improvement. We simulate the entire well lifecycle in a single integrated simulation, help operators to synthesize information, make changes, and continue to improve.
The Value of Subsurface Modeling

ResFrac’s physics-based subsurface modeling helps oil and gas operators to identify inconsistent data, explain complex phenomena, and optimize decision making.
Theoretical and Empirical Problems with the Holistic Permeability Correlation for DFIT Interpretation
In this post, I focus on a particular correlation that is sometimes used in the industry to estimate permeability from a shale DFIT: the ‘holistic permeability correlation.’ I show that this correlation can greatly overestimate permeability. When applied to optimize frac design, well spacing, and cluster spacing, overestimated permeability leads to significant loss of economic value.
Calibration of Wellbore Pressure During and After Fracturing

In this post, I go through basic relationships between variables in a pressure match. I discuss some of the strategies that we use for pressure matching, and try to impart intuition into how different physical processes affect the observations.
Best Practices in Interpretation of DFIT Tests for Shmin, Permeability, and Pore Pressure

DFIT interpretation has been a theme of the work that we’ve done within ResFrac. Our collaborative 2018 Industry Study, which culminated in one of the ‘Best of URTeC’ papers in […]
Modeling Frac Hit Damage in ResFrac

Shale wells often experience huge production losses after a frac hit. For example, Figure 22 from King et al. (2017) shows a parent well in the Woodford that experienced a […]
Another Boulder on the Pile of Evidence Against the Tangent Method of Picking Fracture Closure

There has been a lot of controversy over the past five years over how to estimate stress/closure pressure from shut-in pressure transients from Diagnostic Fracture Injection Tests (DFITs). Today, I […]
2020 ResFrac Symposium

Last month we hosted our annual ResFrac Symposium – our annual event for ResFrac customers. In keeping with the times, the event took place over Zoom instead of in-person. Despite […]
Collaborating with whitson to Improve ResFrac’s Fluid Modeling
Recently, we’ve been fortunate to work with whitson (https://whitson.com/) on work for a mutual client. Founded by Prof. Curtis Whitson at the Norwegian University of Science and Technology, they specialize […]
With Lower Prices, Operators Need to Reoptimize Well Spacing and Frac Design

On April 20, WTI traded as low as -\$37/bbl, the lowest ‘price’ ever. Massive demand reduction caused by COVID-19 coupled with a collapse in OPEC+ supply constraints have conspired to […]
The New ResFrac User Interface
The new ResFrac user interface is fully operational! It was released in November, and since then, we’ve been regularly rolling out major updates. It’s been a large and complex team […]
ResFrac Closes a Round of Equity Financing from Altira Group

At the end of April, we closed a second round of equity financing from Altira Group. This funding gives us a strong cash cushion and puts us in a good […]
Recorded ARMA ‘Robe Talk’ – The Case for Planar Fracture Modeling
Should we use ‘planar fracture’ models or ‘complex fracture network’ models? Exciting new field data has been published by operators that helps us answer this question, at least for modeling hydraulic […]
ResFrac Simulation Training
Thank you to all involved in the ResFrac simulation training course held in early 2020–it was a resounding success! With the subsequent onset of COVID-19 social distancing restrictions, this will […]
ResFrac Office Hours

Join us for ResFrac office hours with the ResFrac team. Each Tuesday evening for at least the next four weeks, the ResFrac team will host a zoom meeting to discuss […]
HFTC 2020

HFTC is next week, and it looks like a great lineup. This week, I skimmed through about 40 of the papers that will be at the conference, and read some […]
Joe Frantz Joins ResFrac Team

It is my great pleasure to become part of the ResFrac team. They are a talented group of hard-working people. I first met Mark over two years ago at an SPE […]
The Case for Planar Fracture Models
This post grapples with a complicated, nuanced, and important topic: what do hydraulic fractures look like and how should we model them? Should we use planar fracture models or ‘complex’ […]
Using RTA to Aid ResFrac History Matching

Rate Transient Analysis (RTA) is commonly used to analyze production in unconventional reservoirs. The concept of RTA is to use rate signatures of producing wells to estimate properties such as permeability and fracture surface area. For more detailed analysis, fracture simulators, reservoir simulators, and coupled fracture/reservoir simulators, like ResFrac, can be used.
DFIT Study Update
The DFIT Industry Study kicked off in January 2018 with six major operators and one service company participating. We have been holding meetings every three months, and the study will conclude at the end of 2018. The detailed results won’t be shared until next year. However, I can now provide a general update on the findings. I am really looking forward to sharing the full results!
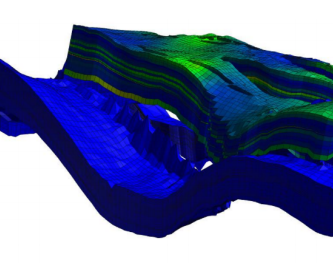
Do fractures propagate symmetrically?

Typically, hydraulic fracture simulations predict symmetrical propagation away from the wellbore. For example, the figure below shows a ResFrac simulation of fracturing and production in a 200 ft horizontal stage […]
Applying ResFrac to Optimize Cluster Spacing

Multistage hydraulic fracturing in horizontal wells enables economic production from low permeability resources. A variety of parameters needs to be optimized: stage spacing, cluster spacing, well spacing, well landing depth, […]
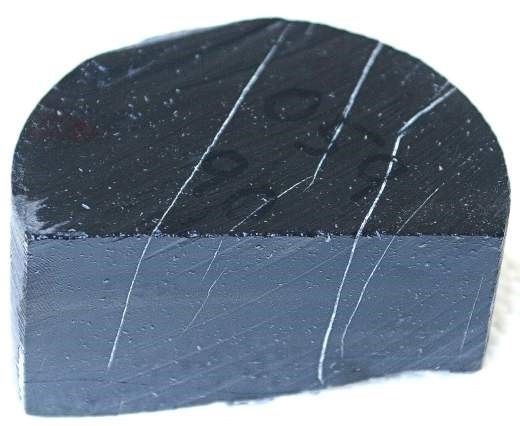
A new core-across study may lead to a paradigm shift in our understanding of hydraulic fracturing in shale

In this post, I discuss an important new paper, “Sampling a Stimulated Rock Volume: An Eagle Ford Example,” by Raterman et al., which was presented at URTeC in July. This paper is an instant classic (kind of like Game 5 of the World Series last Sunday!).
Craig et al. (2017) present data and claim it refutes the fracture compliance method – actually, it shows the exact opposite

Introduction Back in February, I was at an SPE DFIT workshop where David Craig (one of the vocal advocates of the ‘holistic’ method of picking fracture closure) said that he […]
Fluid conduction in closed fractures and implications for DFIT interpretation

In this post, I address a topic that seems esoteric, but it has critical implications for understanding how DFITs respond to closure. In turn, this directly affects how we estimate stress and permeability. The question under investigation: do fractures store and conduct fluid after they close? My answer: in most DFITs, yes. Two caveats: unless the formation is extremely soft or ductile (allowing residual aperture to be nearly zero) or the matrix permeability is sufficiently high (making the residual fracture conductivity so small relative to the matrix permeability that it is negligible). Note that as fluid pressure draws down after mechanical closure, conductivity decreases. So it is possible that fractures that are hydraulically conductive during a DFIT may effectively close when fluid pressure is drawn down during long-term production (this depends on the stiffness and strength of the asperities that allow the mechanically “closed” fracture to retain aperture).
Postclosure DFIT interpretation: Demystifying the Linear Flow Time Function

“Postclosure” interpretation is used to infer formation permeability from DFIT pressure measurements. As reviewed in previous posts, the goal of a DFIT is to infer formation properties, of which permeability […]
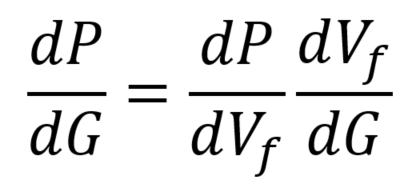
Curving G-function plots and picking closure
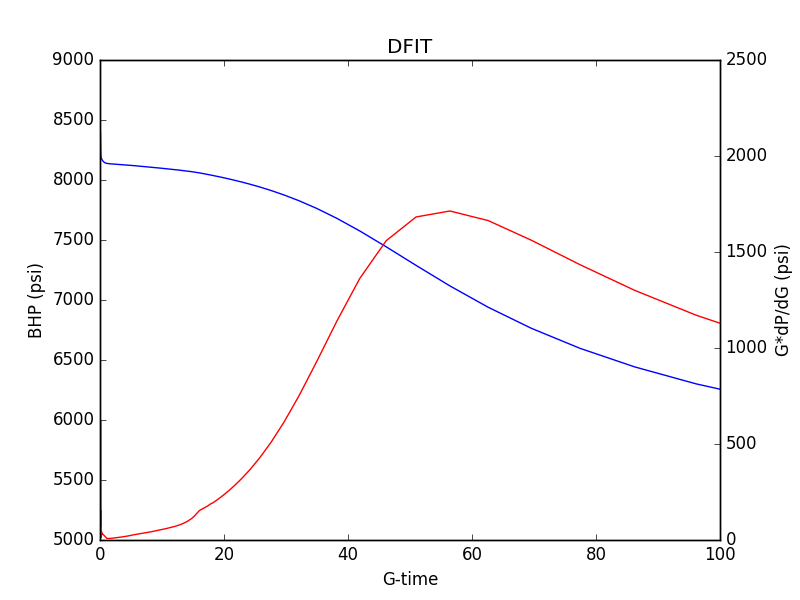
G-function plots are routinely used to interpret diagnostic fracture injection test (DFIT) transients. Ideally, a plot of pressure versus G and G*dP/dG versus G should form a straight line. However, the G*dP/dG curve is very often curving. A typical DFIT transient is shown below.
Demystifying the G-function
Diagnostic fracture injection tests (DFITs) are commonly interpreted by plotting pressure versus a function of time called the G-function. The G-function seems rather arcane and is often misunderstood. However, it has […]
How to plot a DFIT
Aside from the diversity of terminology, the diversity of plotting techniques is the aspect of DFIT analysis that most often causes confusion. Why don’t we just make a Cartesian plot of pressure […]
DFIT, LOT, XLOT, Minifrac, Microfrac, Fracture Calibration Test: Navigating the Terminology
A bewildering variety of terms are used to describe tests in which a small volume of fluid is injected to create a hydraulic fracture: DFIT, leakoff test (LOT), extended leakoff […]
Diagnostic Fracture Injection Tests: The Basics
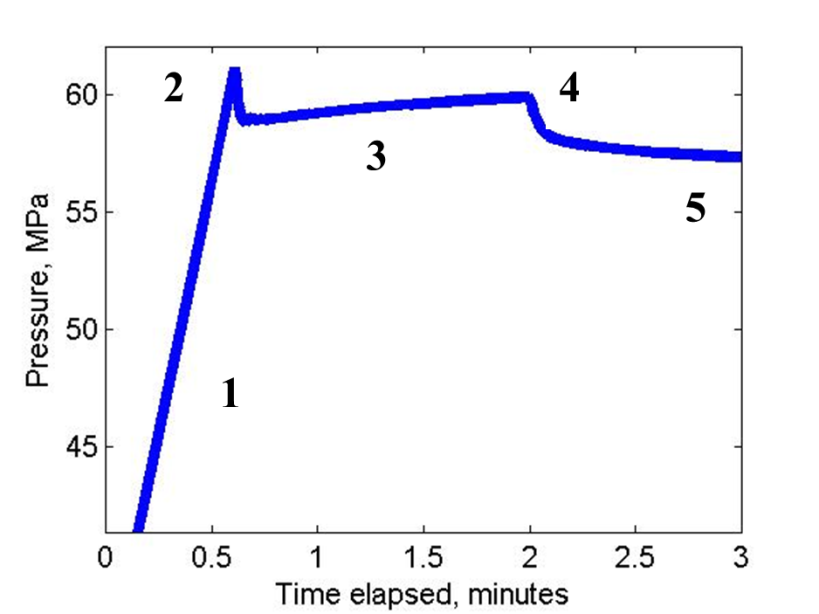
In a diagnostic fracture injection test (DFIT), a relatively small volume of fluid is injected into the subsurface, creating a hydraulic fracture. After the end of injection, the pressure in […]