The new ResFrac user interface is fully operational! It was released in November, and since then, we’ve been regularly rolling out major updates. It’s been a large and complex team effort. The heavy lifting was done by Charles Kang, Soma Medam, and engineers with MentorMate. Particular thanks to Mariyana Naidenova, Denislav Ganchev, Zdravko Tyankov, Milen Metodiev, and Frank Anselmo. The design was created by Kevin Braun and Fernando Diaz from Momentum Design Labs.
The simulations are run on the Microsoft Azure server. There is a locally installed user-interface to set up the simulation, visualize results, and keep track of your simulations.
Here is the job manager, which allows you to set up and manage simulations:
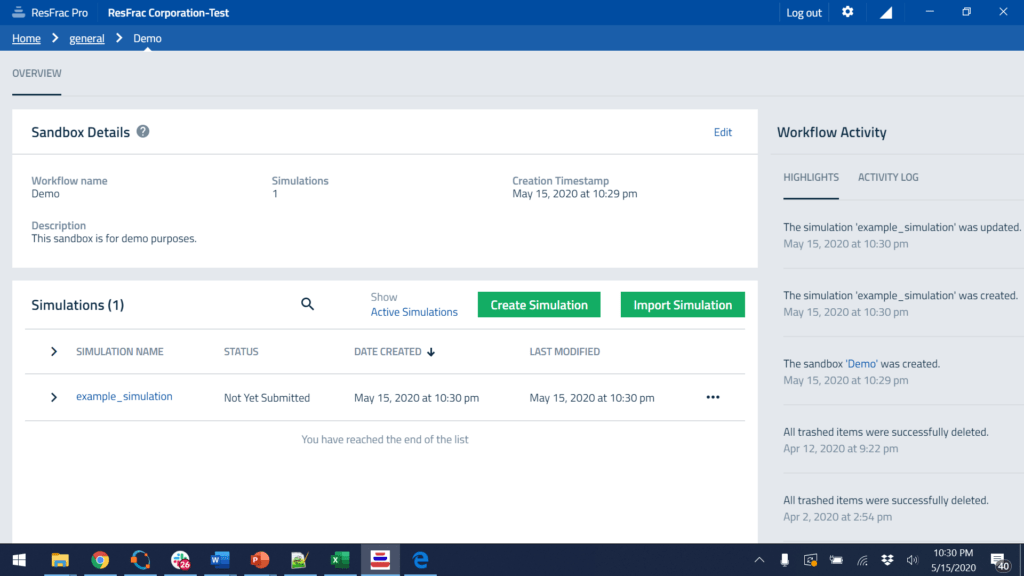
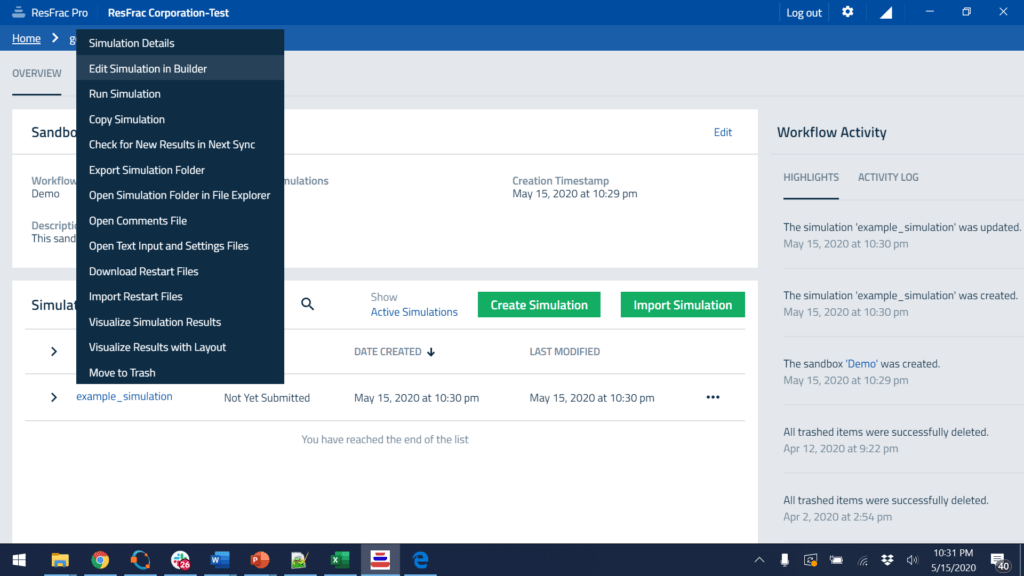
If you click on a simulation, it opens up a variety of useful options, from editing in the simulation builder, visualizing results, submitting to run on the cloud server, copying, deleting, importing or exporting, recording notes about each simulation, and more.
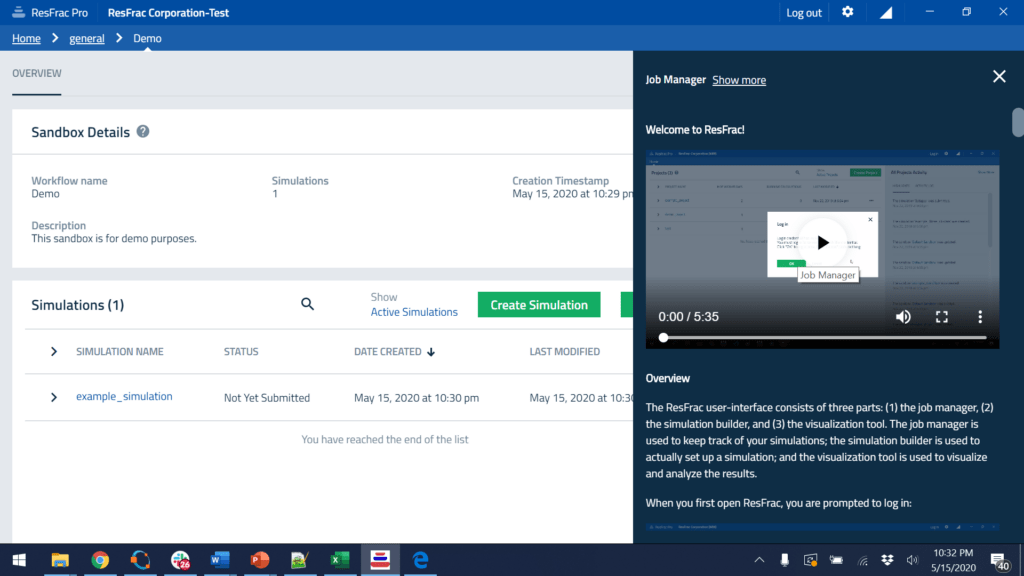
We have built-in multimedia help content throughout the user interface. For example, clicking the? icon in the job manager pulls up a five-minute demo video and written help content. The ‘Show more’ button makes it full-screen.
If you open the simulation builder to edit a simulation, you find more built-in help content, such as the 3-minute tutorial video below. The ? button on the right-hand side brings up extensive help content with videos, pictures, and equations.

To set up a simulation, you start at the first panel and work down. Every user entry is checked with a validation function, which reports errors (things that have to be corrected to run the simulation) and warnings (things that may or may not be wrong and do not need to be corrected to run the simulation).
There are a huge number of interactions between inputs that need to be handled. Users can choose black oil or compositional, thermal or isothermal, dual porosity or single porosity, poroelastic or not, thermoelastic or not, rotated mesh or not, etc. These choices affect inputs throughout the user interface. For example, if a simulation is thermal, then you need to specify injection temperature, formation thermal conductivity and heat capacity, the thermal gradient in the formation, etc. The user interface handles all these interactions by showing or hiding inputs as needed. The validation functions are applied to only the ‘visible’ controls. The validation functions make it easy to update the simulation options. For example, if I switch to ‘Thermal’ from ‘Isothermal’, and press save, the validation window will pop up and give me ‘errors’ telling me where I need to make changes to provide information relevant to the thermal option.
Clicking the green cube at the top of the screen pulls up a 3D preview window, so you can see the model as you construct it. The 3D visualization tool allows the user to decide what to visualize and provides a variety of intuitive options to customize the view. This 3D preview viewer is a simplified version of the visualization tool used for full simulations, which is discussed below.
In many places, you have the ability to pull up windows for 2D plotting. Some of these plots reproduce the user-input, and sometimes, the plots do complex calculations to derive quantities from the user-inputs.
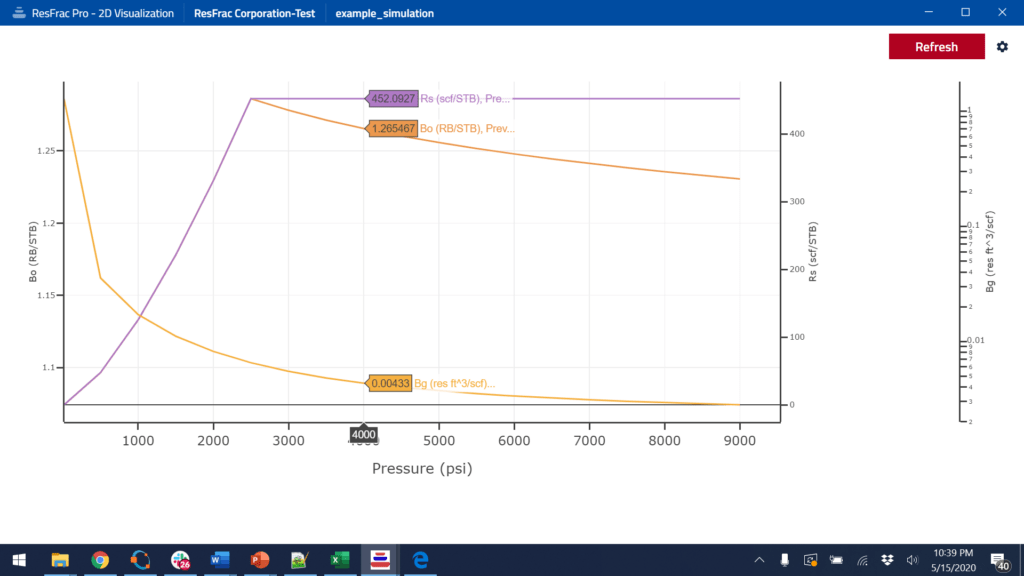
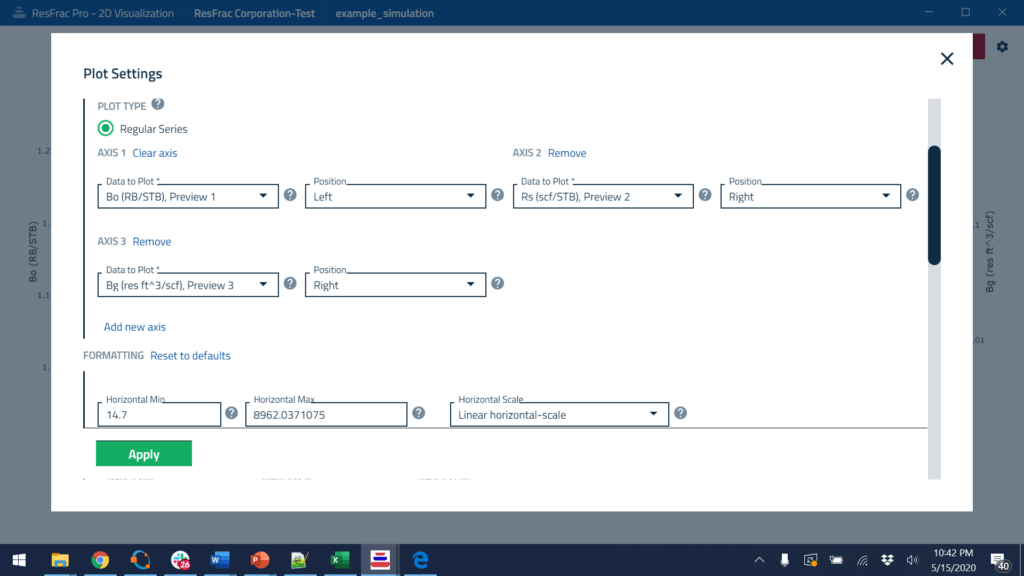
The 2D plotting tool offers a lot of customization, such as the ability to use multiple y-axes, log or Cartesian, change line color and style, change font size, and more.
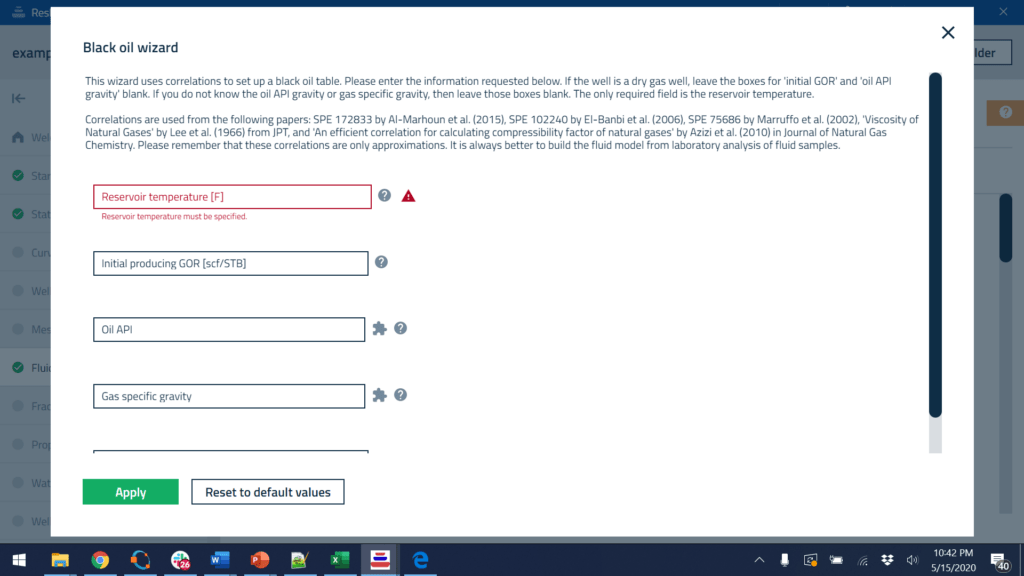
Throughout the simulation builder, we provide wizards that facilitate the process of setting up a simulation, and/or fill gaps in data. We provide wizards for: importing and upscaling formation properties, setting up black oil and compositional fluid models, importing wellbore surveys, setting up injection stages and perforations, setting up the simulation mesh, setting up pressure dependent permeability, setting up proppants, setting up injection fluids, and setting up production boundary condition controls. The wizards are supplemented by the built-in 2D plotting tools that allow the user to preview their inputs.
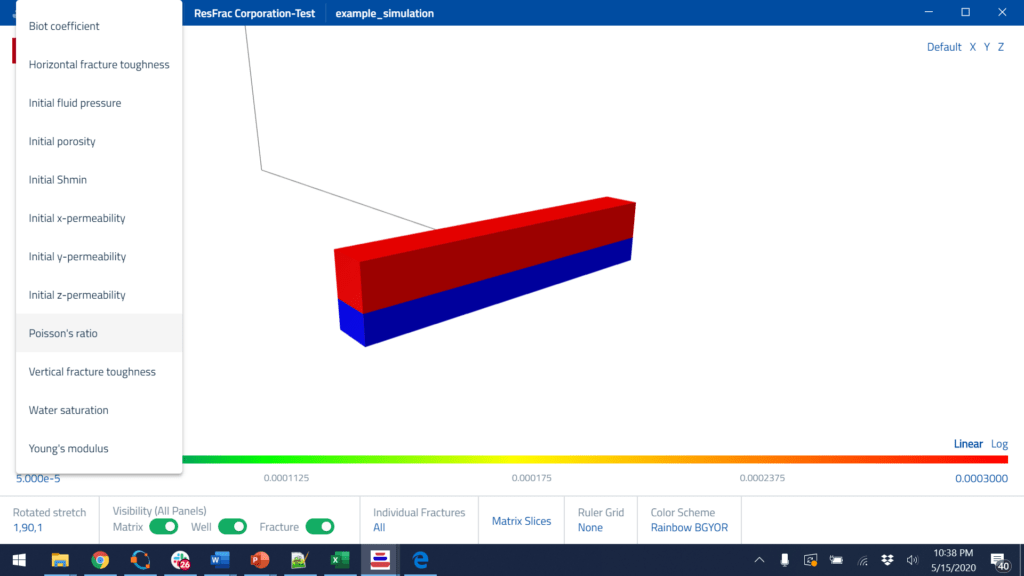
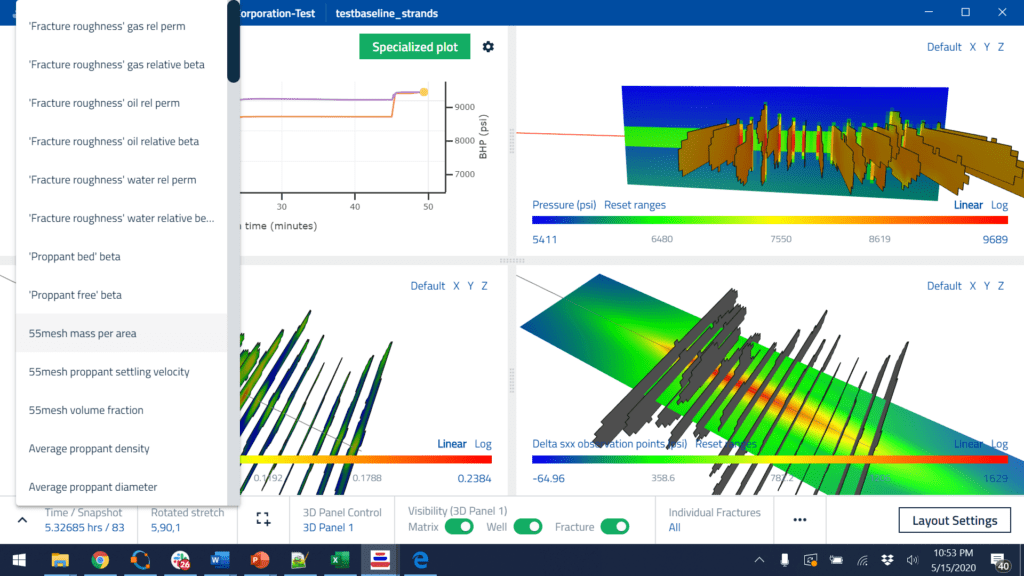
When visualizing results from a simulation, you have an extensive list of options to customize the visualization. You can show 1-6 separate visualization panels, with either line plots or 3D images. In each 3D panel, you can link or decouple the camera angle. You can select from a wide range of properties to visualize. You can toggle visibility for wells, fractures, matrix, individual fractures, the color bar, the 3D axis, etc. To see inside, you can cut slices through the matrix. The images below are stretched 5x in the direction perpendicular to the fractures to enhance visibility. We prefer to align the mesh with the direction of fracture propagation, and so you have the ability to rotate the mesh with respect to the X-Y coordinate system. To support this feature, the visualization tool allows you to stretch in a direction that is rotated from North-South/East-West. Also, you can plot contours of induced stresses in planes cut through the model, show a ruler grid, change the color scale, take a screenshot, or make a movie.

As in the 2D preview plots in the simulation builder, you can customize the appearance of the line plots. You even have the ability to make ‘specialized plots’ such as G-function plots, log-log plots, and rate-transient analysis plots. Also, you can import external datasets and plot them simultaneously with the simulated data. For example, during history matching, you may want to plot the actual production data against simulated.
We offer the ability to save a layout that stores the appearance of the plot. You can use this to speed up visualization. Once you’ve set up a layout that you like, you can open a visualization with a layout directly to that view. The layout includes things such as the imported external dataset, making it easy to history match.
When we were developing the simulation builder and the visualization tool, we put a lot of effort into responsiveness. The 3D visualizations open in only a few seconds. You can use a slider bar to move back and forth in time, with minimal lag. When we first developed the new simulation builder, we were initially surprised at the slow performance we saw in some aspects, particularly with large tables. We did a complex code refactor to avoid unnecessary work, and it is now highly responsive, even with large amounts of data.
The structure of the user interface will be the subject of a future blog post. It is written with a hybrid approach. The front end is written using Node.js , Electron , and Angular, which is one of the most modern and visually appealing user-interface libraries. Under the hood, the user interface is running inside a self-contained web browser. With relatively minimal modification, the entire user interface could be served as a web app accessible through your browser. However, we opted for a locally installed user interface to minimize lag and allow the program to run even without an internet connection. On the back-end, the simulation builder and visualization tool are running C++. The hybridization is accomplished using Node Addons with N-API. The C++ programming language provides high-end performance, which is how we can load and manipulate 3D visualization datasets with excellent responsiveness. For example, on the fly, we need to perform operations such as matrix slicing, and rotated stretch. We use an open source 3D graphics library for the actual rendering, but the low-level setup of the visualization vertices and triangles is performed in the C++. Also, the ResFrac simulator is written in C++, and we are able to directly incorporate some of its code into the UI. For example, if you are doing a compositional simulation, the 2D preview capability allows you to simulate a constant compositional expansion from within the UI. The calculation is performed with the ResFrac simulator’s flash calculation engine. Also, all of the input file read/write functions and validation functions are directly shared between the UI and simulator, avoiding duplication and eliminating the need to maintain consistency across two separate code bases. When submitting a simulation, we use secure REST APIs to communicates directly with the ResFrac cloud services hosted on Microsoft Azure. We’ve gone through a process of SOCII compliance, which means that we have an external auditor visit us in-person once a year and review the entire company’s security practices. As simulations run, they are continuously download. They automatically delete from the server a few weeks after being downloaded.
The input files are human-readable ASCII files. Editing them directly is possible (though unnecessary because of the user interface). This month, we are releasing a ‘command line’ submission interface that will allow power users to write their own scripts to set up batches of simulations, submit them, and analyze them. This is easy because simulation inputs and outputs are stored in human-readable format.
Working with the team on this UI, I have been struck by the incredible attention to detail that is required. As consumers, we take so much for granted about how computers behave. But in practice, almost everything, from tiny details, must be thought about and implemented. For example, if you are importing a simulation, you need open a dialog box to select the simulation on your computer. The next time that you import a simulation, that dialog box ought to open up to the same place it opened previously. This saves the user a few seconds and provides the convenience you’d expect from a modern application. But this doesn’t happen by default! An engineer has to identify and implement this refinement. There are countless little things like this throughout the code – a lot of thought has gone into it! And we are constantly soliciting feedback from users. So we constantly field new ideas and continue rolling out refinements.
The next major development push for the UI is to enable automated history matching, sensitivity analysis, and design optimization. It is a significant challenge for us to design a user interface that makes it easy and intuitive to set up these kinds of complex computer-assisted processes. However, we have formulated a solid design, and are excited to implement it. Our strategy is to piggyback on the huge amount of work that’s already been done – the infrastructure of integrating help content into the program, integrating the underlying C++ data model with the front end, integration with validation functions, etc. So keep an eye out for that release later this year!