Postclosure DFIT interpretation: Demystifying the Linear Flow Time Function

“Postclosure” interpretation is used to infer formation permeability from DFIT pressure measurements. As reviewed in previous posts, the goal of a DFIT is to infer formation properties, of which permeability […]
Curving G-function plots and picking closure
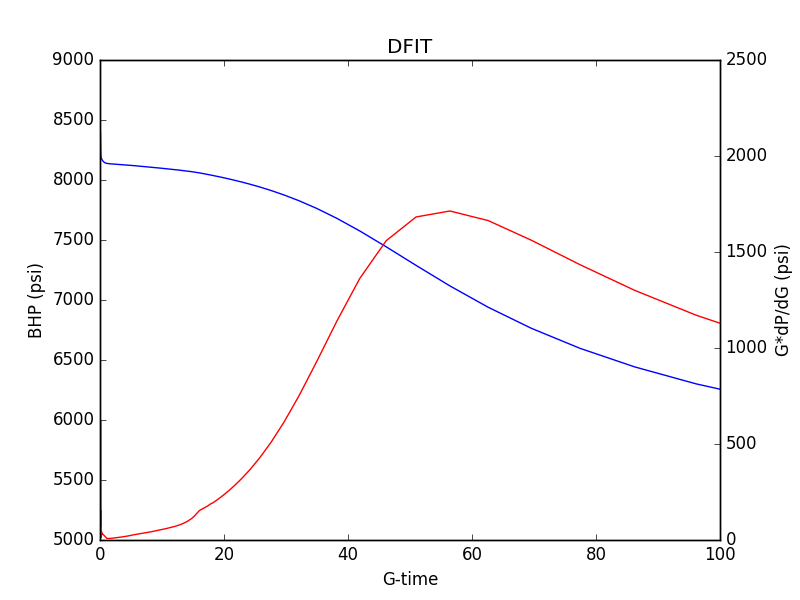
G-function plots are routinely used to interpret diagnostic fracture injection test (DFIT) transients. Ideally, a plot of pressure versus G and G*dP/dG versus G should form a straight line. However, the G*dP/dG curve is very often curving. A typical DFIT transient is shown below.
Diagnostic Fracture Injection Tests: The Basics
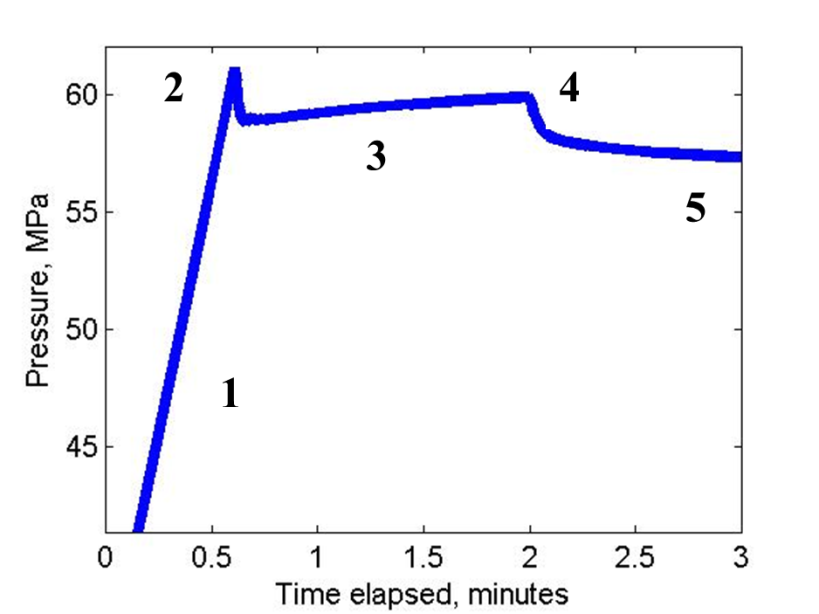
In a diagnostic fracture injection test (DFIT), a relatively small volume of fluid is injected into the subsurface, creating a hydraulic fracture. After the end of injection, the pressure in […]