Curving G-function plots and picking closure
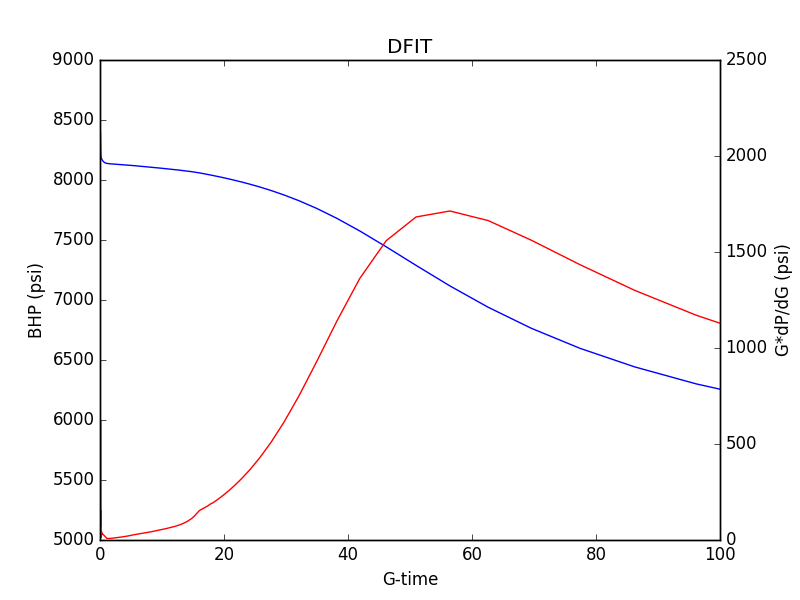
G-function plots are routinely used to interpret diagnostic fracture injection test (DFIT) transients. Ideally, a plot of pressure versus G and G*dP/dG versus G should form a straight line. However, the G*dP/dG curve is very often curving. A typical DFIT transient is shown below.
Demystifying the G-function
Diagnostic fracture injection tests (DFITs) are commonly interpreted by plotting pressure versus a function of time called the G-function. The G-function seems rather arcane and is often misunderstood. However, it has […]
How to plot a DFIT
Aside from the diversity of terminology, the diversity of plotting techniques is the aspect of DFIT analysis that most often causes confusion. Why don’t we just make a Cartesian plot of pressure […]