
This month’s release has a feature that I am particularly excited about – automatic report generation. The reports are generated automatically when a simulation finishes. Also, reports can be generated on-demand for simulations that have already been completed. The reports are highly customizable, allowing the user to generate different line plots, 3D visualizations, preview plots, and tabular data. The user can provide a template PPT, so that the report is made with their preferred PPT style.
The challenge in creating a ‘report’ capability is that users have a huge diversity of preferences about what to put into the report. ResFrac has hundreds of parameters that can be outputted in time-series data and in the 3D visualizations. Depending on what the user is doing, they may want their report to show all sorts of different things. To address, we’ve given the report tool a breadth of capabilities and flexibility. Kudos to our developer Jiaqi Du who implemented this feature!
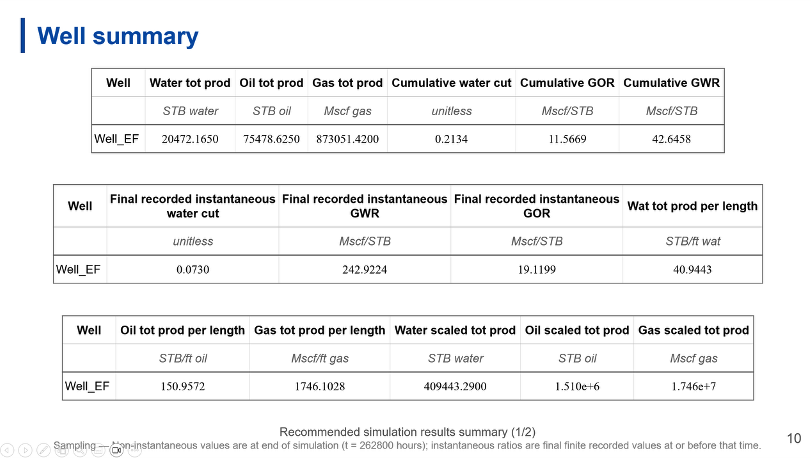
The ResFrac release comes preloaded with a default report template. The images below show a few examples.
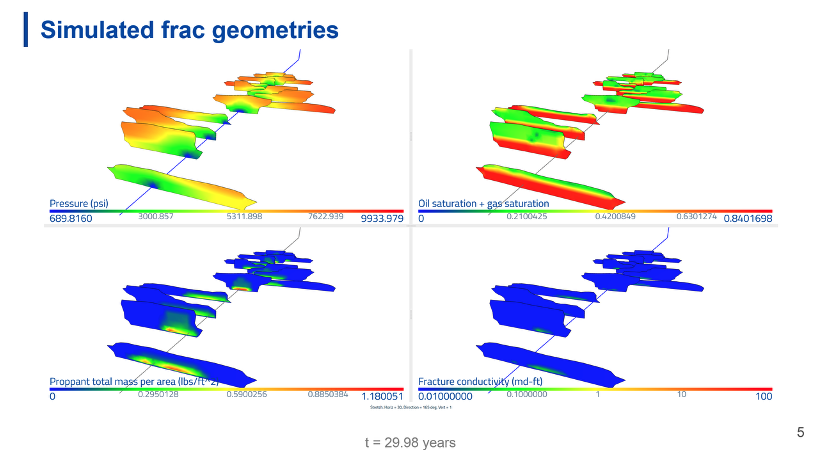
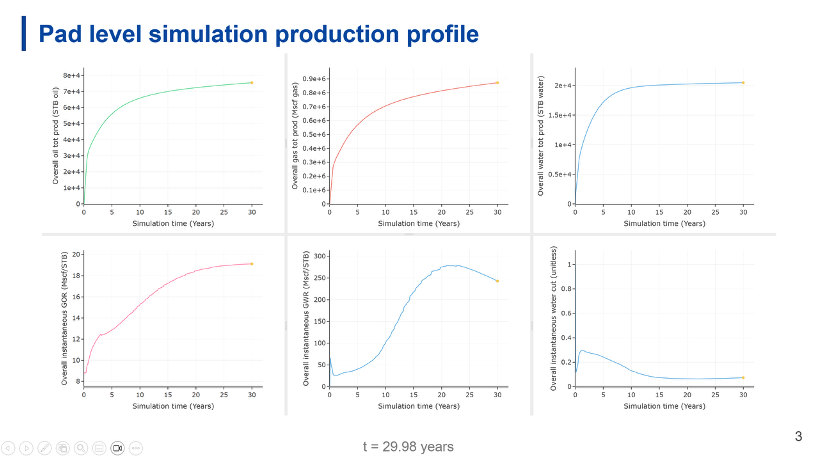
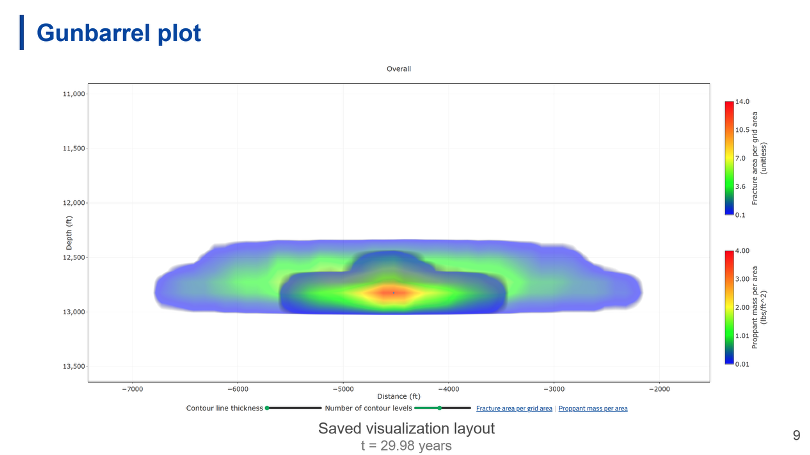
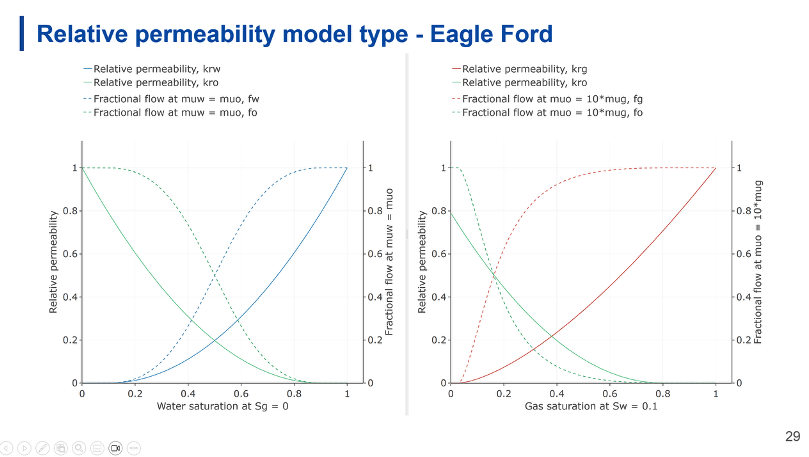
The 3D images and the line plots from the ResFrac viz tool are generated by presaved layout files. A preexisting capability that we’ve had for many years, layouts allow the user to save the exact setup of a visualization and then reopen it or another simulation later with the same appearance. Layouts contain the full gamut of plotting configuration options – font size, min/max scales, line colors, etc. By preparing layouts in advance, and then incorporating them into the report configuration, the user can fully customize the plots in the report.
For this release, we added several new options for the layout capability. The 3D camera angle can now be saved on a ‘relative’ basis. With a relative layout, if you save a simulation centered on a reservoir at 9500 ft depth, and then open that same layout on a different simulation, in which the reservoir is at 8000 ft, then the layout will adjust the camera center to focus at the correct location. The same is done with camera angle, stretch direction, etc. Similarly, the user now has the option to save the 2D line plot scales as either absolute or ‘relative’ to the values in the plotted data, depending on whether or not they want the line plots to rescale for each dataset.
Tabular summary data can be calculated on the fly by the report generation tool. For example, the user could output the total production at years 1, 5, 10, and 30. The tool will read the simulation files, compile those numbers, and place them in the table. Most conveniently, the report tool has the ability to adaptively identify the end of stages, so that, for example, you could output pressure or uniformity index at the end of each stage (without having to manually tell the tool at which times to do these outputs).
Finally, the report can output information about the simulation setup. All of the preview plots available in the simulation builder tool are available (such as the relative permeability curves shown above). These outputs are provided for documentation purposes, so that the reports can memorialize the background information about how the simulation was set up.
To customize the reports, the user provides a text-based configuration file. We’ve prepared detailed documentation to explain to the user how to format the file. To get started, the easiest is to copy an existing configuration file and make changes from there. The user can also create additional layout files in the viz tool and modify the configuration file to point to their new layouts.
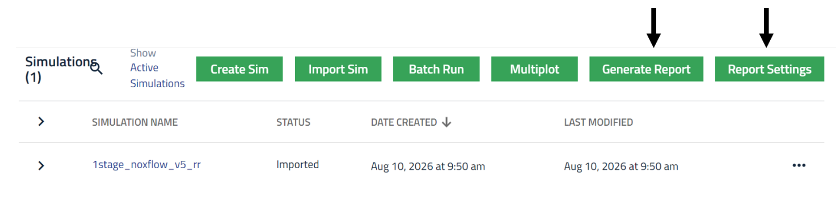
To generate reports, the user clicks on the “Generate Report” button and selects one or more simulations and one or more configuration files. It will then use all the selected configurations to create reports for all the selected simulations. Also, in “Report Settings,” the user can tell the tool to automatically generate one or more reports for each simulation when the finish. The default report configuration can be different in each sandbox folder. So for example, you might have a Bakken project in one sandbox, which is creating reports of a specific design, and then in a different sandbox, have a different configuration set up for a Permian project.
For full details, refer to the “ResFrac Report Configuration Guide” and the “ResFrac Report Template Slide Guide” in ResFrac’s resources/documentation folder. The report configuration files and PPT template exports are placed in the data/ReportConfigs folder. Finally, there is a brief intro video below.
I think this will prove to be one of the more popular improvements that we’ve made to ResFrac in recent years. Please let us know how it goes!